
Severity-Based Log Routing with the OpenTelemetry Collector
🚀 Building Solutions in Observability | Co-Founder of OllyGarden As the co-founder of OllyGarden, I focus on creating tools and frameworks that enhance observability and address challenges in telemetry and distributed systems. My work leverages expertise in OpenTelemetry and insights from industry collaborations to develop practical, scalable solutions.
💡 A Career Rooted in Technology and Innovation With experience spanning startups, enterprise environments, and global collaborations, I bring a well-rounded approach to building software systems. My focus areas include observability practices, data pipelines, and message queue processing, ensuring reliability and efficiency in modern systems.
🤝 Collaborating Across the Ecosystem I value working with and learning from others in the technology ecosystem. Through discussions with experts and partnerships, I continuously seek to address industry challenges and uncover new opportunities for growth and innovation.
🌱 Continuous Development I am dedicated to refining my skills in software engineering and advancing observability practices. By staying engaged with emerging technologies and trends, I aim to develop solutions that address real-world challenges and drive progress in the field.
🎯 How I Can Contribute
- Addressing observability challenges
- Implementing OpenTelemetry solutions
- Exploring partnerships to bring ideas to life
Log storage costs scale with volume, and modern applications generate extraordinary volumes. A distributed system handling thousands of requests per second can easily produce millions of log records daily, the vast majority of which are INFO or DEBUG messages that exist primarily for post-hoc debugging. Sending all of this to a managed observability backend accumulates costs rapidly, yet dropping these logs entirely means losing the context you need when something goes wrong.
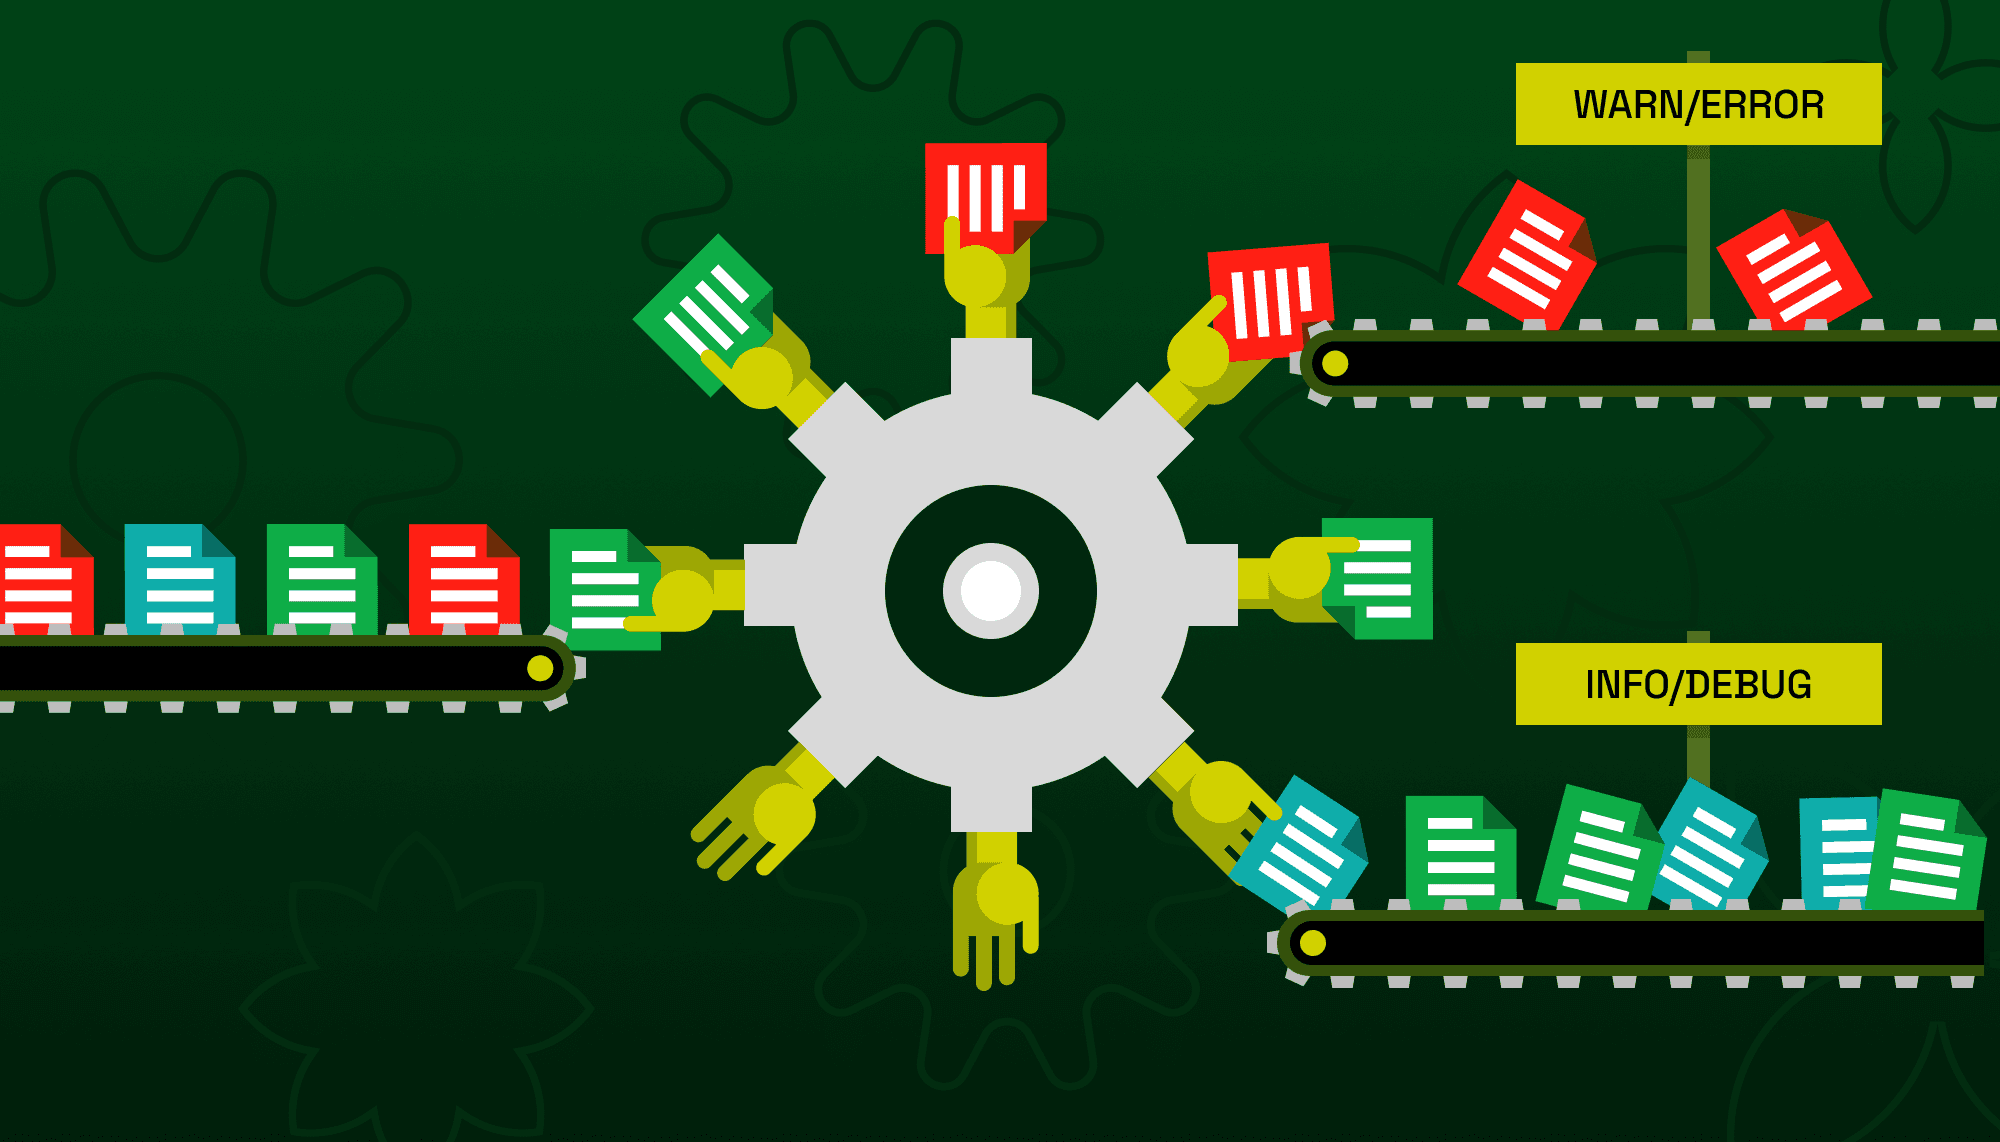
Analysis of real-world log traffic reveals a striking pattern: the vast majority of logs sent to vendor backends are INFO severity and lower. In my KubeCon North America 2025 talk with Michele Mancioppi, we presented findings showing this imbalance across production environments. The ideal scenario inverts this distribution: vendor backends should primarily receive WARN and above, the logs that signal problems requiring attention, while verbose logs flow to cheaper storage tiers.
The fundamental insight is that not all logs require the same storage tier. ERROR and WARN messages demand immediate visibility and fast query performance because they indicate problems requiring human attention. INFO and DEBUG messages, by contrast, primarily serve forensic purposes: understanding what happened before an error occurred. These forensic logs can tolerate slower query performance and longer retrieval times in exchange for dramatically lower storage costs.
The OpenTelemetry Collector's routing connector enables this tiered storage pattern by evaluating each log record's severity and directing it to the appropriate destination. Important logs flow to your vendor backend for alerting and dashboards. Verbose logs flow to object storage for cost-effective archival. The result is observability that remains comprehensive without the comprehensive bill.
Understanding Log Severity in OpenTelemetry
Before configuring routing, understanding how OpenTelemetry represents log severity is essential. The OTLP data model defines a 24-level severity scale through the severity_number field, grouped into six base levels with four sub-levels each.
| Range | Base Level | Typical Use |
|---|---|---|
| 1-4 | TRACE | Fine-grained debugging, execution flow |
| 5-8 | DEBUG | Diagnostic information for developers |
| 9-12 | INFO | Normal operational messages |
| 13-16 | WARN | Potential issues that may require attention |
| 17-20 | ERROR | Errors that require investigation |
| 21-24 | FATAL | Critical failures, system crashes |
The base severity number for each level represents the first value in its range: TRACE is 1, DEBUG is 5, INFO is 9, WARN is 13, ERROR is 17, and FATAL is 21. When routing by severity, you compare against these base values.
The severity_text field preserves the original severity name from the source logging framework. A Java application using java.util.logging might emit SEVERE as severity_text while the collector maps it to severity_number 17 (ERROR). This dual representation lets you route on normalized numbers while retaining source-specific terminology.
OTTL, the OpenTelemetry Transformation Language used by the routing connector, provides named constants for severity comparisons. Writing severity_number >= SEVERITY_NUMBER_WARN is clearer than writing severity_number >= 13 and survives specification changes should the numeric values ever be updated.
The Routing Connector
The routing connector is a connector component that evaluates telemetry against a routing table and forwards it to matching pipelines. Unlike processors that transform data in place, connectors sit between pipelines, receiving from one and emitting to others. This architecture enables fan-out patterns where a single input pipeline routes to multiple output pipelines based on arbitrary conditions.
For severity-based routing, the connector examines each log record's severity_number field and routes to different pipelines depending on the value. The routing table uses OTTL conditions, so you have access to the full expression language for complex routing logic.
The connector operates as both an exporter (from the perspective of the input pipeline) and a receiver (from the perspective of output pipelines). This dual role is reflected in how you wire it in the service section: the input pipeline exports to the connector, while output pipelines receive from it.
Complete Configuration
The following configuration demonstrates severity-based routing with two tiers: important logs (WARN and above) route to an observability backend via OTLP, while informational logs (INFO and below) route to local files for archival. This example uses a local LGTM stack (Loki, Grafana, Tempo, Mimir) as the vendor backend, making it easy to test the pattern locally before deploying to production.
Start the LGTM stack with Docker, mapping the OTLP gRPC port to 14317 to avoid conflicts with the collector:
docker run -d --name lgtm -p 3000:3000 -p 14317:4317 grafana/otel-lgtm
receivers:
  otlp:
    protocols:
      grpc:
        endpoint: 0.0.0.0:4317
      http:
        endpoint: 0.0.0.0:4318

processors:
  batch/vendor:
    timeout: 1s
    send_batch_size: 1024
    send_batch_max_size: 2048

  batch/file:
    timeout: 10s
    send_batch_size: 5000
    send_batch_max_size: 10000

exporters:
  otlp/lgtm:
    endpoint: localhost:14317
    tls:
      insecure: true

  file:
    path: ./archive.jsonl
    rotation:
      max_megabytes: 100
      max_days: 7
      max_backups: 10
    format: json

connectors:
  routing/severity:
    default_pipelines: [logs/archive]
    error_mode: ignore
    table:
      - context: log
        condition: severity_number >= SEVERITY_NUMBER_WARN
        pipelines: [logs/vendor]

service:
  pipelines:
    logs/intake:
      receivers: [otlp]
      exporters: [routing/severity]

    logs/vendor:
      receivers: [routing/severity]
      processors: [batch/vendor]
      exporters: [otlp/lgtm]

    logs/archive:
      receivers: [routing/severity]
      processors: [batch/file]
      exporters: [file]
The configuration defines three pipelines forming a routing topology. The intake pipeline receives all logs via OTLP and exports to the routing connector. The routing connector evaluates each log record: those with severity_number >= SEVERITY_NUMBER_WARN (13 or higher, meaning WARN, ERROR, or FATAL) route to the vendor pipeline, while everything else routes to the archive pipeline via default_pipelines.
Notice that each output pipeline has its own batch processor with different parameters. The vendor pipeline uses aggressive batching with 1-second timeouts and smaller batches optimized for near-real-time delivery. The archive pipeline uses relaxed batching with 10-second timeouts and larger batches optimized for file write efficiency. This demonstrates a key benefit of the routing pattern: each destination can have processing tuned to its characteristics.
Configuration Walkthrough
The routing/severity connector configuration warrants closer examination.
connectors:
  routing/severity:
    default_pipelines: [logs/archive]
    error_mode: ignore
    table:
      - context: log
        condition: severity_number >= SEVERITY_NUMBER_WARN
        pipelines: [logs/vendor]
The default_pipelines field specifies where unmatched logs route. In this configuration, logs that do not match the WARN-or-higher condition route to the archive pipeline. Without default_pipelines, unmatched logs would be silently dropped, which is rarely the desired behavior.
The error_mode: ignore setting determines behavior when OTTL condition evaluation fails. With ignore, evaluation errors log a warning and route the affected log to default_pipelines. The alternative, propagate, causes evaluation errors to fail the entire batch, potentially losing data. Production configurations should almost always use ignore.
The context: log setting means the condition evaluates per individual log record. Alternative contexts like resource evaluate once per ResourceLogs batch, which is more efficient but cannot inspect log-level fields like severity_number. For severity-based routing, log context is required.
The condition severity_number >= SEVERITY_NUMBER_WARN uses OTTL's named severity constant. This matches WARN (13-16), ERROR (17-20), and FATAL (21-24). The SEVERITY_NUMBER_WARN constant evaluates to 13, the base value for the WARN range.
Routing to Multiple Destinations
Some organizations want important logs sent to both the vendor backend and archival storage for redundancy. The routing connector supports this by listing multiple pipelines in a single route.
connectors:
  routing/severity:
    default_pipelines: [logs/archive]
    error_mode: ignore
    table:
      - context: log
        condition: severity_number >= SEVERITY_NUMBER_WARN
        pipelines: [logs/vendor, logs/archive]
With this configuration, ERROR and WARN logs route to both pipelines, while INFO and DEBUG route only to archive. This ensures critical logs have redundant storage while still benefiting from reduced vendor costs for verbose logs.
Splitting at INFO
The boundary between important and archival logs is a policy decision. The example above uses WARN as the threshold, sending INFO to archival storage. Some organizations prefer to keep INFO in the vendor backend for operational visibility while archiving only DEBUG and TRACE levels.
connectors:
  routing/severity:
    default_pipelines: [logs/archive]
    error_mode: ignore
    table:
      - context: log
        condition: severity_number >= SEVERITY_NUMBER_INFO
        pipelines: [logs/vendor]
Changing SEVERITY_NUMBER_WARN to SEVERITY_NUMBER_INFO shifts the boundary. Now INFO (9-12), WARN (13-16), ERROR (17-20), and FATAL (21-24) route to the vendor, while only DEBUG (5-8) and TRACE (1-4) route to archive.
The cost implications depend on your log distribution. If 90% of your logs are DEBUG level, archiving DEBUG yields substantial savings. If DEBUG logs are rare but INFO logs are prolific, archiving only DEBUG may not meaningfully reduce vendor costs.
Handling Unspecified Severity
Log records may arrive with severity_number set to 0 (SEVERITY_NUMBER_UNSPECIFIED) when the source did not map severity correctly. These ambiguous logs need a routing decision. The safest approach treats unknown logs as potentially important by adding or severity_number == 0 to the vendor routing condition. We will cover strategies for inferring and mapping severity from log content in a future article.
Performance Considerations
The routing connector evaluates conditions for every log record when using log context. High log volumes make condition evaluation a meaningful cost. OTTL condition compilation happens once at startup, but evaluation happens continuously during operation.
Simple numeric comparisons like severity_number >= SEVERITY_NUMBER_WARN are fast. Avoid expensive operations in routing conditions. String matching with IsMatch and regular expressions, body parsing with ParseJSON, and complex boolean logic all add evaluation cost that multiplies by log volume.
If your routing logic requires expensive operations, consider whether a transform processor earlier in the pipeline could precompute the routing decision into an attribute. Routing on a precomputed attribute is faster than repeating expensive evaluations.
processors:
  transform/route_tag:
    log_statements:
      - context: log
        statements:
          - set(attributes["route"], "vendor") where severity_number >= SEVERITY_NUMBER_WARN
          - set(attributes["route"], "archive") where severity_number < SEVERITY_NUMBER_WARN

connectors:
  routing/severity:
    default_pipelines: [logs/archive]
    table:
      - context: log
        condition: attributes["route"] == "vendor"
        pipelines: [logs/vendor]
This pattern moves routing logic to the transform processor, which executes once per log record. The routing connector then performs a simple attribute comparison. For complex routing logic involving multiple conditions, this approach consolidates evaluation.
Batching Strategy
The batch processor configuration for each output pipeline affects efficiency and latency. The vendor pipeline typically wants low latency for alerting, so smaller batches with short timeouts make sense. The archive pipeline optimizes for throughput and file write efficiency, so larger batches with longer timeouts are appropriate.
File write efficiency improves with larger batches. Writing many small chunks incurs filesystem overhead, while larger batches amortize that cost. The archive pipeline's batch configuration targets larger payloads:
processors:
  batch/file:
    timeout: 10s
    send_batch_size: 5000
    send_batch_max_size: 10000
These parameters produce batches up to 10,000 log records or 10 seconds of accumulation, whichever comes first. The file exporter then writes these batches efficiently with its built-in rotation handling.
The vendor pipeline uses more aggressive parameters for responsiveness:
processors:
  batch/vendor:
    timeout: 1s
    send_batch_size: 1024
    send_batch_max_size: 2048
One-second timeout ensures logs reach the vendor backend quickly for alerting. Smaller batch sizes prevent individual batches from becoming unwieldy.
Trade-offs and Limitations
Severity-based routing assumes severity numbers are correctly populated. Logs with missing or incorrect severity will route incorrectly. If your log sources do not reliably set severity, you may need preprocessing to infer severity from log content before routing decisions occur.
Routing decisions are permanent within a single collector deployment. Once a log routes to archive, it does not also appear in the vendor backend unless you explicitly configure dual routing. If you later need archived logs for investigation, you query your archive storage rather than your vendor's fast query interface. Ensure your archive storage has adequate query tooling for forensic analysis.
Verification
After deploying severity-based routing, verify that logs route as expected. Use telemetrygen to send test logs at different severity levels and check each destination.
Send an INFO log, which should route to archive:
telemetrygen logs --otlp-insecure --severity-number 9 --severity-text INFO \
  --body "Test info message" --logs 1
Send a WARN log, which should route to vendor:
telemetrygen logs --otlp-insecure --severity-number 13 --severity-text WARN \
  --body "Test warning message" --logs 1
Verify the routing by checking both destinations. The INFO log should appear in the local archive.jsonl file, while the WARN log should appear in Loki at http://localhost:3000 (the LGTM container started earlier).
Summary
Severity-based log routing enables tiered storage without sacrificing observability. Important logs reach your vendor backend for fast querying and alerting. Verbose logs reach archival storage for cost-effective retention. The OpenTelemetry Collector's routing connector makes this pattern straightforward to implement.
The key configuration elements are the routing connector with OTTL conditions on severity_number, separate output pipelines for each destination, and batch processor tuning appropriate to each destination's characteristics. The pattern scales with log volume since routing decisions are per-record evaluations of simple numeric conditions.
Start by analyzing your log distribution across severity levels. If verbose logs dominate volume, severity-based routing can meaningfully reduce vendor costs. If important logs dominate, the savings may be modest. Either way, the architectural separation between immediate visibility and archival storage provides flexibility for future optimization.